

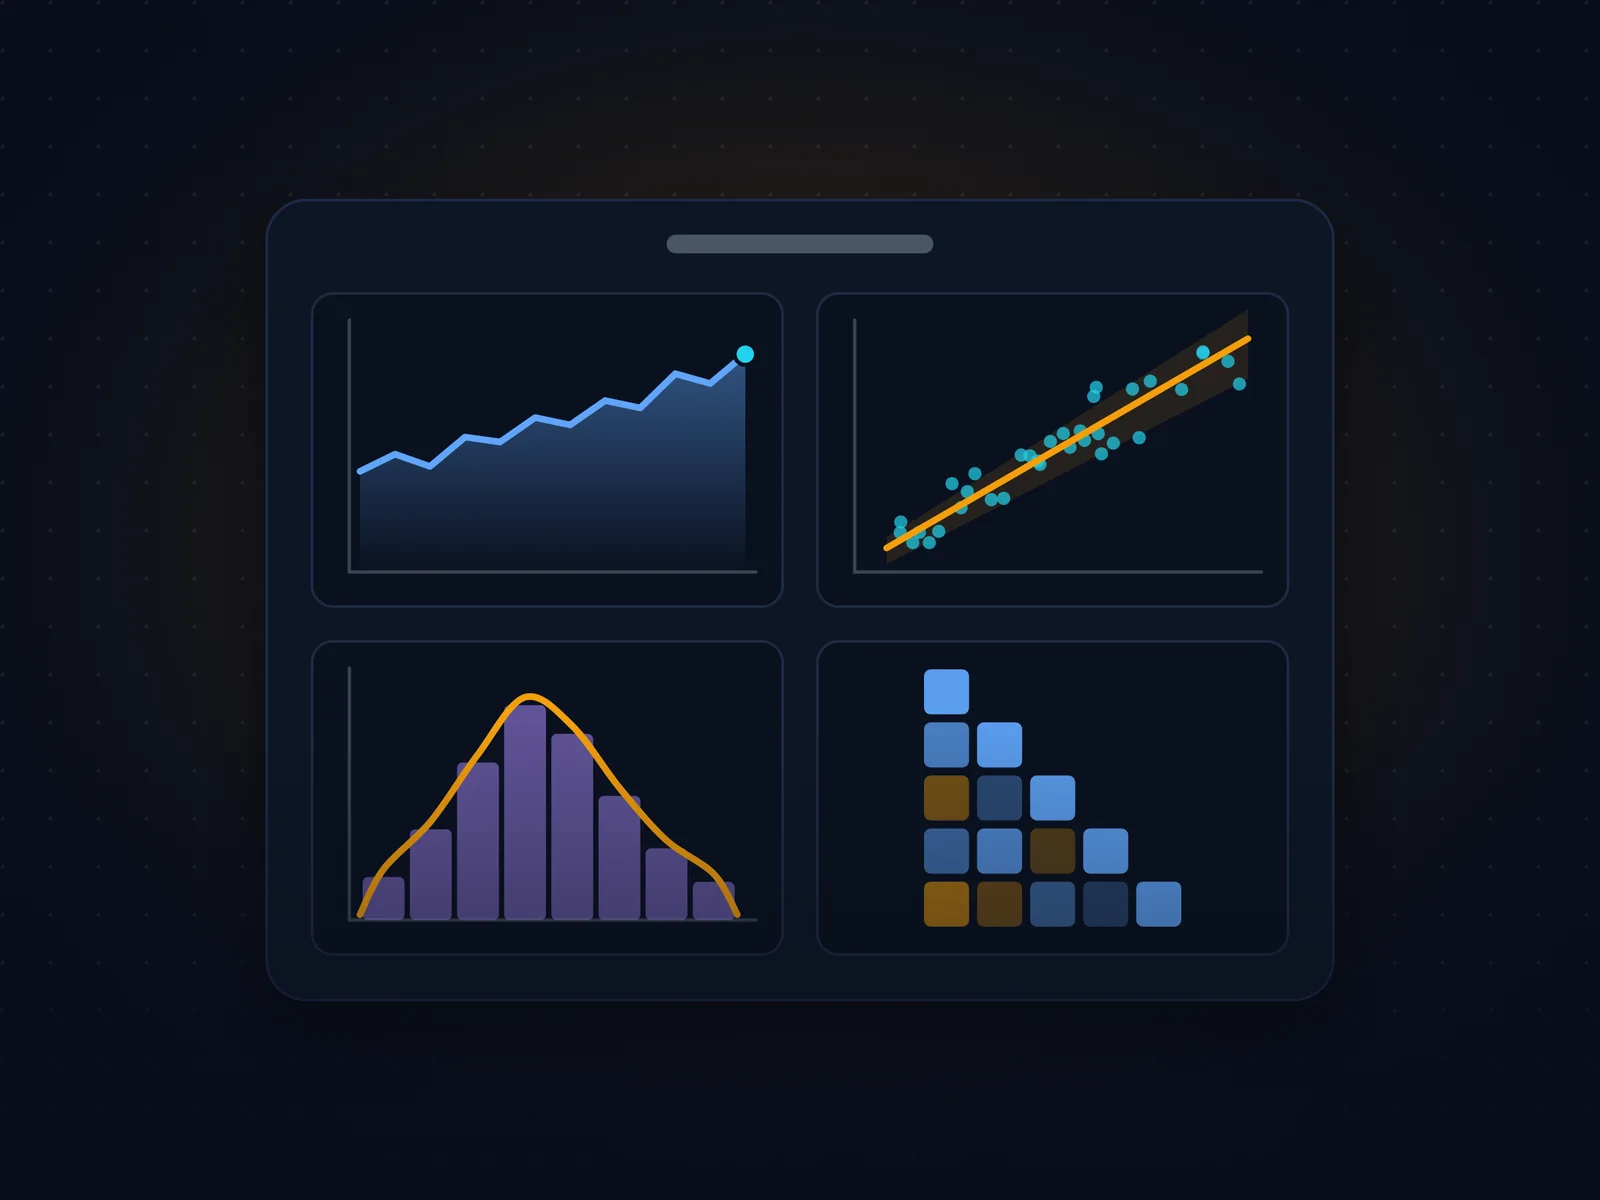
FreeWorkbook
Data Visualization71 tasks · 2 phases + final challenge
Matplotlib & Seaborn Practice Workbook
Practise Matplotlib and Seaborn on a realistic e-commerce dataset, from first plots to dashboards.
Free
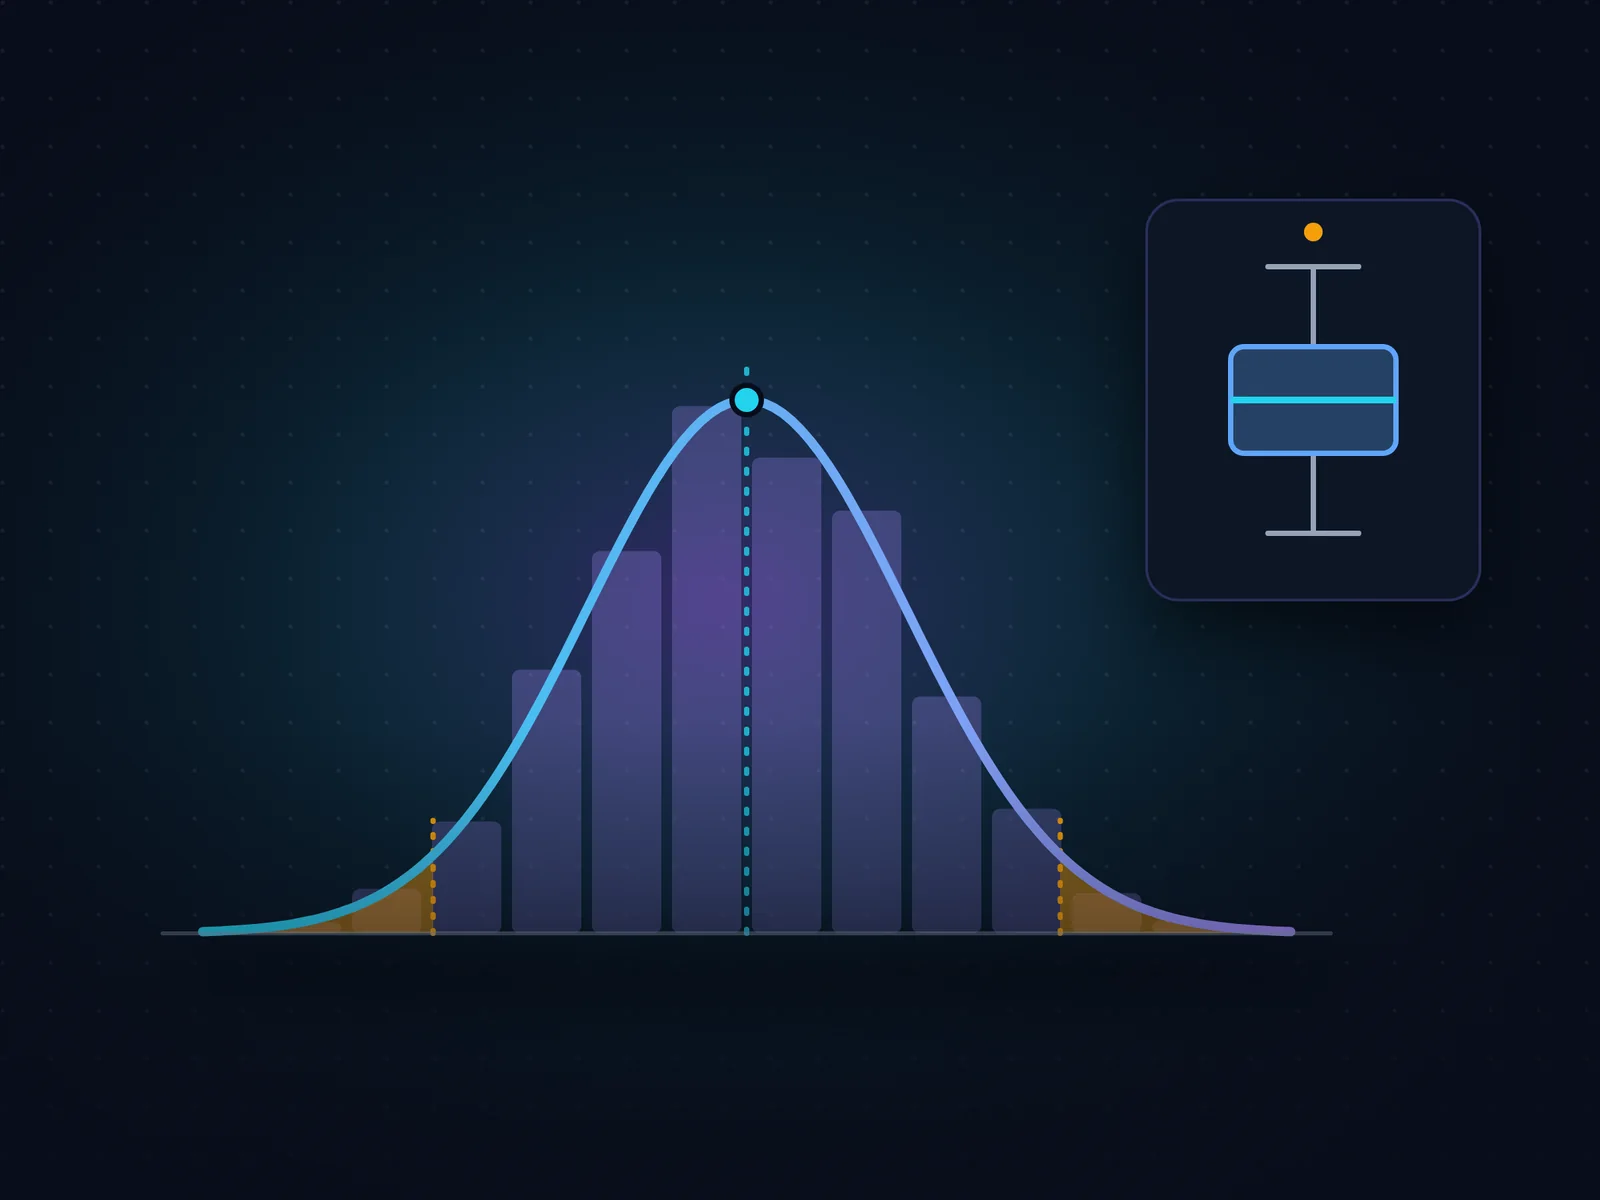
Learn statistics by doing it on TechNova Global, a synthetic HR dataset of 2,500 employees with a skewed salary column, outliers, missing survey answers, and a mix of real and non-significant relationships.
A learning phase covers descriptive statistics, probability, Bayes' theorem, sampling and hypothesis testing step by step. A testing phase makes you choose the right method yourself — with interview questions, debugging tasks and judgment calls — and a final take-home style challenge asks whether the company's remote-work policy is working. Hints and worked solutions are on request.
// related
Data Visualization71 tasks · 2 phases + final challenge
Practise Matplotlib and Seaborn on a realistic e-commerce dataset, from first plots to dashboards.
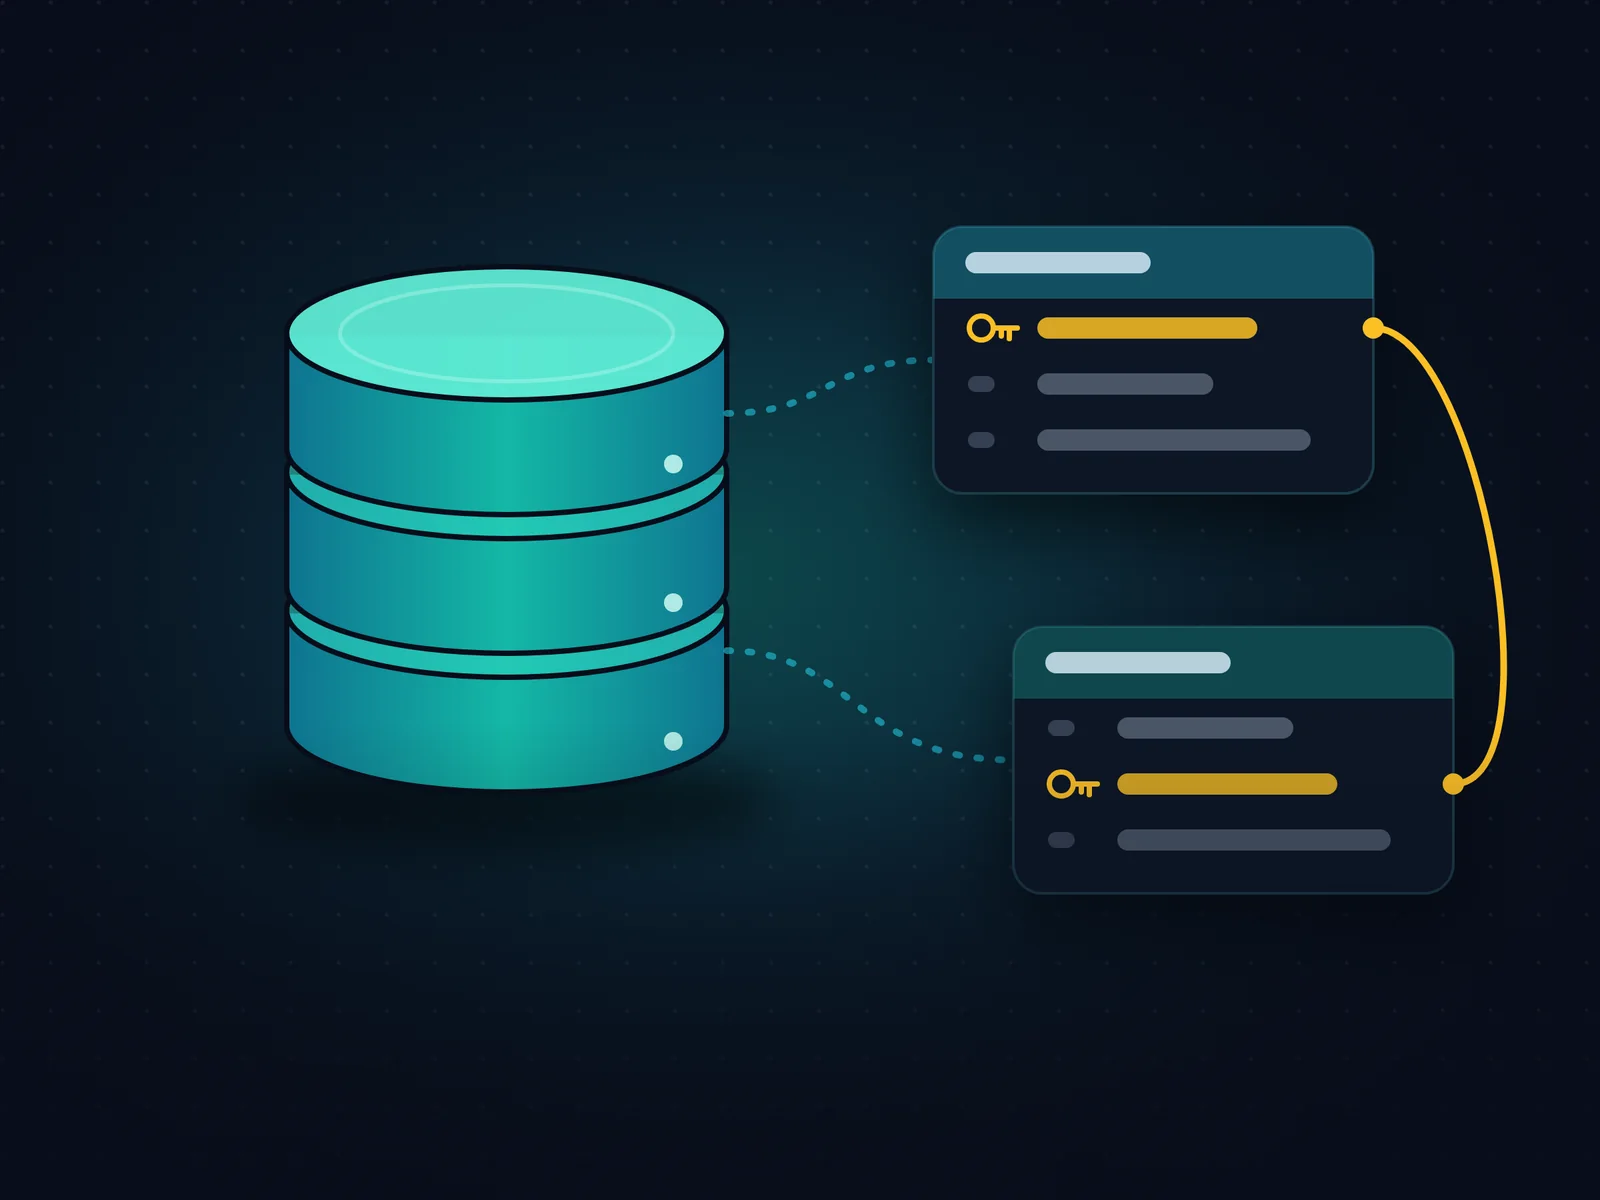
SQL171 questions · 3 capstones · final assessment
SQL for data and AI roles on a 32-table SaaS dataset, validated on PostgreSQL and MySQL.
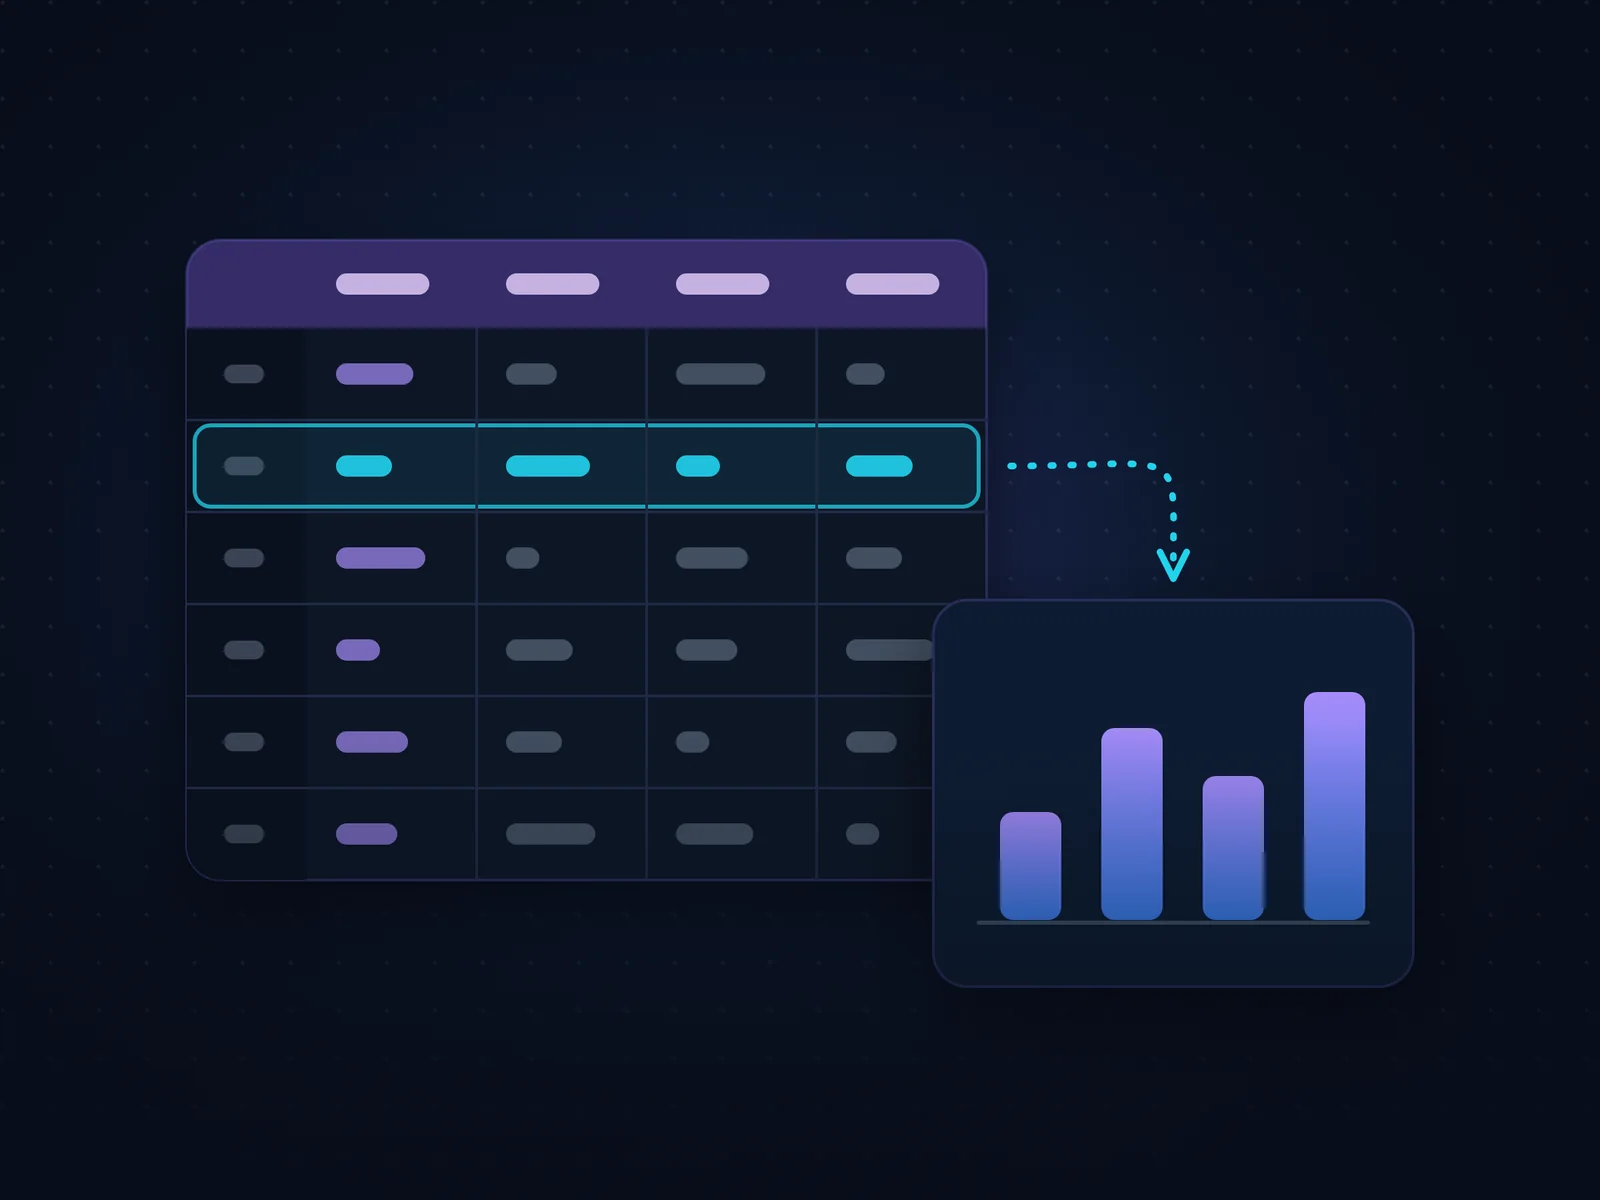
NumPy & Pandas75 challenges · 2 phases + capstone
Guided, then independent Pandas challenges, ending in an end-to-end customer retention report.