

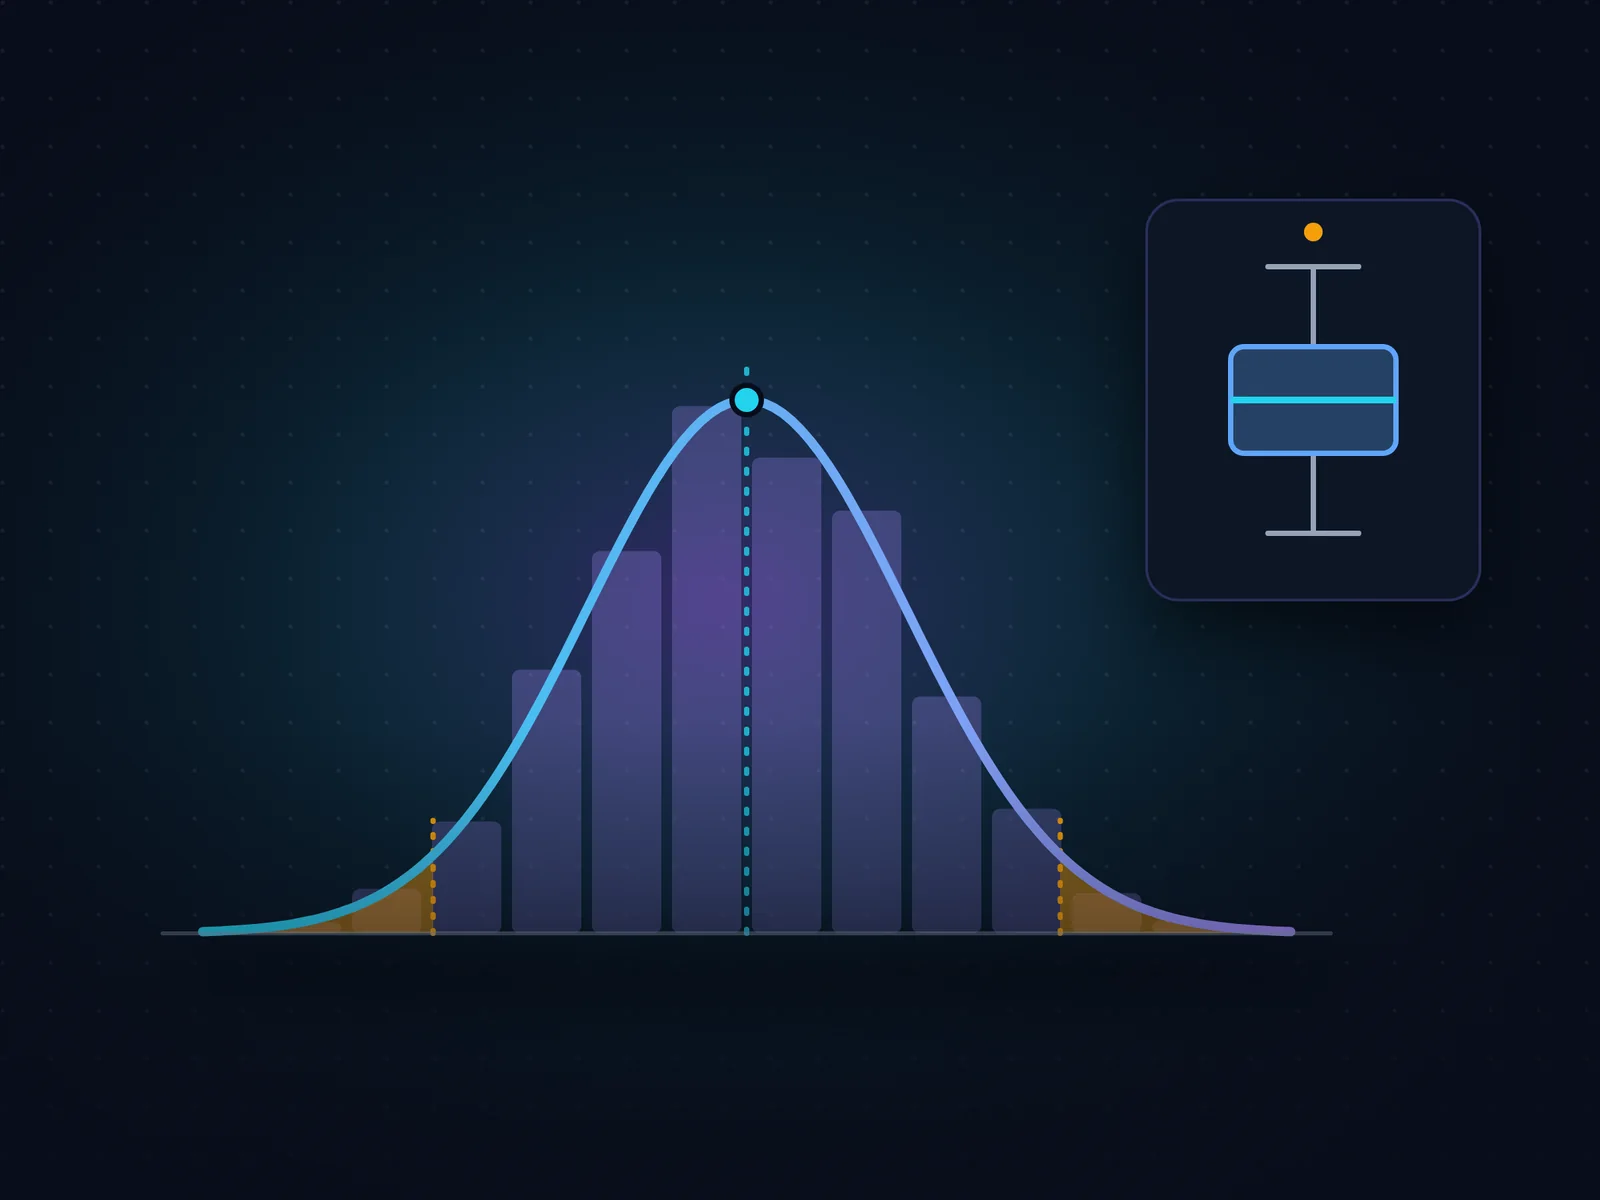
FreeWorkbook
Statistics & Machine Learning98 tasks · 2 phases + final challenge
Statistics & Probability Practice Workbook
Practise statistics and probability on a realistic HR dataset, from averages to hypothesis tests.
Free
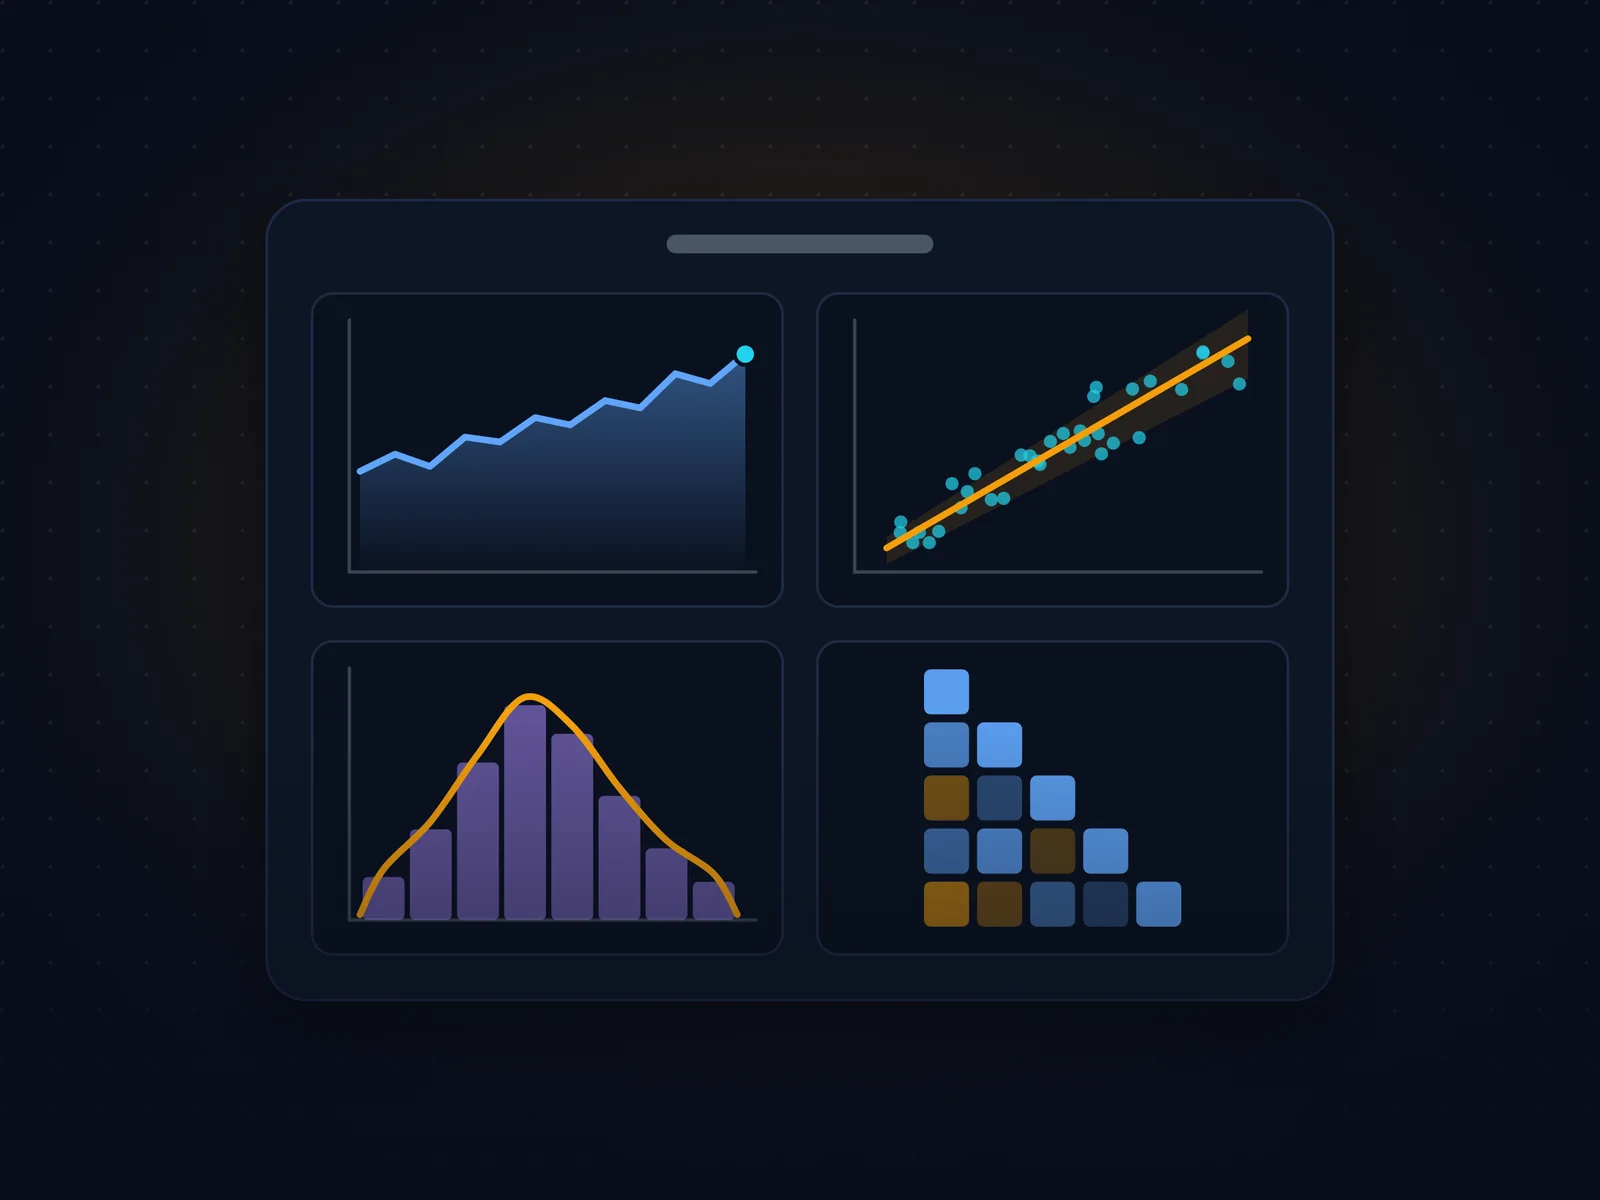
Build real plotting fluency on TechNest Retail, a synthetic e-commerce dataset with 4,012 orders over two years — including the missing values, duplicate orders and inconsistent labels you meet in real data.
A learning phase walks through Matplotlib and Seaborn one concept at a time, a testing phase makes you choose the right chart yourself — with debugging and "is this chart misleading?" questions — and a final challenge builds an executive one-page dashboard. Hints and full solutions are on request.
// related
Statistics & Machine Learning98 tasks · 2 phases + final challenge
Practise statistics and probability on a realistic HR dataset, from averages to hypothesis tests.
SQL171 questions · 3 capstones · final assessment
SQL for data and AI roles on a 32-table SaaS dataset, validated on PostgreSQL and MySQL.
NumPy & Pandas75 challenges · 2 phases + capstone
Guided, then independent Pandas challenges, ending in an end-to-end customer retention report.